Building a Personal Sleep Temperature Dashboard
This project started from a practical problem: I wanted more control and visibility over my sleep temperature setup without relying entirely on a subscription system.
I use a Sleepme Dock Pro, which is basically a water-based temperature control system for the bed. The official system works, but I wanted to understand more clearly what was happening over time: what temperature the dock was actually set to, what the bed temperature looked like, how the room temperature and humidity were changing, and how all of those signals affected the target temperature.
So I started building my own local dashboard around it.
The project uses a local Umbrel server, Sleepme Dock Pro data, dashboard rendering, CSV logging, and automation scripts to make the system easier to see and reason about. Over time it turned into a hands-on exercise in hardware integration, data logging, dashboard design, debugging, and making a messy real-world system more understandable.
The problem
The original goal was simple: I wanted better sleep temperature control.
But the deeper problem was visibility. A sleep-temperature system touches a lot of variables at once:
- room temperature
- room humidity
- bed temperature
- water temperature
- target temperature
- whether someone is detected in bed
- what the control logic thinks should happen next
- whether the system is actually allowed to send a command
Without a dashboard, all of that is mostly hidden. You can feel the result, but you cannot easily see the system thinking.
I wanted something more transparent. Not because the official app was useless, but because I wanted to understand the whole loop myself.
What I built
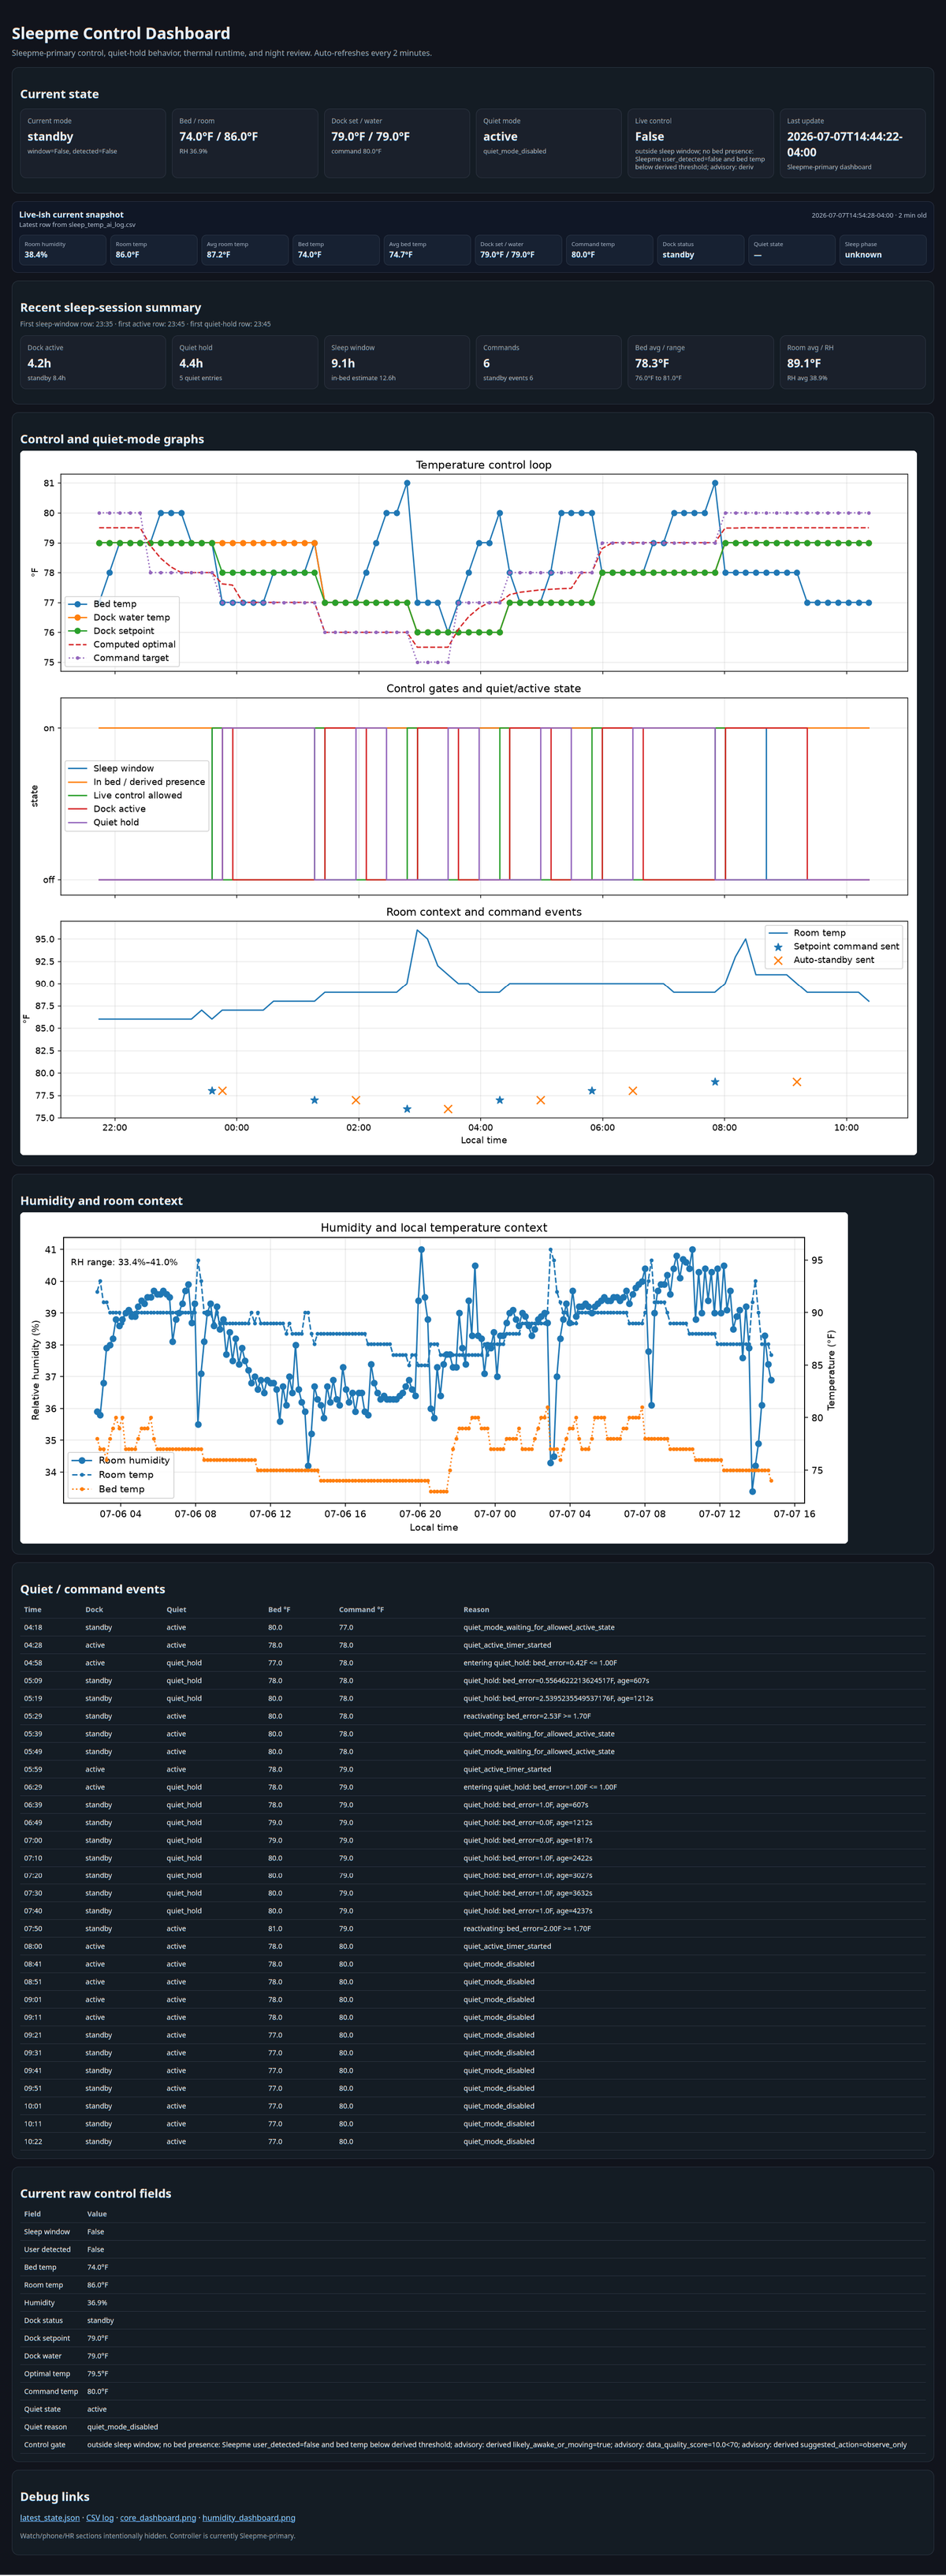
I built a local dashboard that runs from my Umbrel server and pulls together the most important parts of the sleep-temperature system into one place.
The dashboard tracks things like:
- room temperature
- room humidity
- water temperature
- bed temperature
- computed target temperature
- temperature control graph
- control gates graph
- room context and command events
- humidity and local temperature context
- raw control fields for debugging
The idea is not just to show pretty numbers. The goal is to make the system legible. I want to be able to look at the dashboard and understand why the controller is making a decision, or why it is refusing to make one.
That part matters because automation can become dangerous or annoying when it becomes invisible. If a system changes something in the real world, I want to know what it is doing and why.
Why local control matters
I tend to prefer local control when I can get it. Part of that is privacy and security, but part of it is also practical independence.
When a system only works through a cloud service or a subscription, the user gets less control over the thing they already own. Sometimes that is fine. But in a case like this, where the device is part of my sleep environment, I wanted more direct visibility and the ability to build around my own needs.
A local dashboard means I can keep the information closer to home, modify the system myself, and build features that may not exist in the official product.
It also lets me learn by actually working with the system instead of just accepting whatever the app shows me.
What went smoothly
The basic dashboard and logging side went surprisingly smoothly.
Once the system had clear goals, a lot of the automation became straightforward: collect the data, write it down, render the dashboard, and make the important state visible.
That was one of the main lessons of the project. Automation is not always mysterious. A lot of the difficulty is defining the goal clearly enough that the system can be built around it.
When I knew what I wanted to see, the dashboard started to make sense.
What got complicated
The complicated part came when I tried to bring in live heart-rate metrics from my watch.
At first, I wanted the controller to use heart-rate data more directly. That seemed like a useful signal because sleep temperature, sleep stages, and body state are all connected. But the official API access I wanted was not really available in the way I needed.
So I started experimenting with making my own Android app and watch app to sync the data locally. That technically worked as a direction, but it created a new problem: battery usage on the watch. It was not worth making the watch worse just to get an extra signal into the dashboard.
So I backed off from that approach.
Now I mostly use the Sleepme data itself. The system still has some body-state awareness through its own detection and sleep-phase-related behavior, but I do not currently rely on broad live heart-rate control.
That was a useful design lesson: sometimes the more advanced version of a project is not actually the better version. A simpler system that runs reliably is often better than a more complex system that creates new problems.
What I learned
This project taught me a lot about working with real-world automation.
The main thing I learned is that real systems are messy. They are not just code. They involve hardware, sensors, rooms, bodies, timing, batteries, APIs, missing data, stale values, and weird edge cases.
A script can be logically correct and still not be useful if the real-world context is wrong.
That is why I ended up caring so much about visibility. The dashboard is not just a control panel. It is a way of making the system explain itself.
I also learned that there is a difference between “can I make this work?” and “should this be part of the reliable system?” The watch-data experiment is a good example. It was interesting, and it taught me something, but the final system did not need to depend on it.
Why this project matters to me
I like projects where the digital system meets the physical world.
This one involved software, hardware, environmental data, automation, and practical debugging. It was not just a screen project. It affected an actual room, an actual device, and an actual nightly routine.
That is the kind of work I find interesting: taking a messy real-world system, making it visible, understanding its behavior, and slowly improving it.
In the end I was finally able to stop sweating at night lol